 Friday, May 17, 2024
  Friday, May 17, 2024
Digital real estate platform Wahi finds the share of Greater Toronto Area neighbourhoods in overbidding territory has more than doubled since February.
With the spring real estate market continuing to heat up, the majority of Greater Toronto Area neighbourhoods entered overbidding territory last month, according to digital real estate platform Wahi.
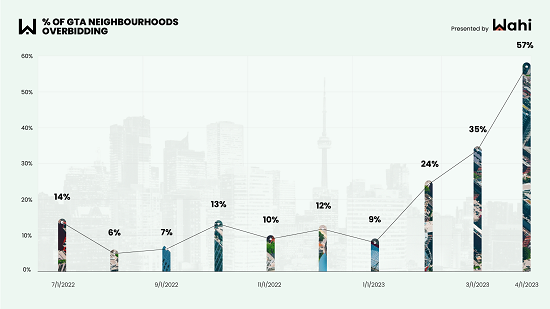
In April, 57% of neighbourhoods across the GTA were in overbidding territory, Wahi analysis reveals. To identify overbidding and underbidding neighbourhoods each month, Wahi compares the differences between list and sold prices for all homes, including condo units and houses. Overall, there were 168 overbidding neighbourhoods last month out of a total of 294 (Wahi tracks about 400 GTA neighbourhoods monthly, but those with fewer than five transactions aren’t considered). In comparison, March saw 110 neighbourhoods in overbidding territory. If a neighbourhood is in overbidding territory, it generally means that most homes within its borders are selling for over asking.
April marks the third consecutive time that the share of overbidding neighbourhoods in the GTA has substantially increased on a month-over-month basis. In March, about 35% of neighbourhoods were in overbidding territory, and in February the share of overbidding neighbourhoods reached 24%, up from 9% in the first month of the year.

When the percentage difference between median list and sale prices is positive, a neighbourhood is in overbidding territory. Homebuyers can draw multiple possible conclusions from this. “These neighbourhoods don’t have enough inventory, or plenty of buyers are shopping in that neighbourhood, or sellers are listing homes below recent sales prices to attract bidding wars,” explains Wahi CEO Benjy Katchen. “Homebuyers need to be armed with information on recent comparable sales and know realistic values to both win in a multiple-offer situation and avoid overpaying,” he adds.
Looking only at condo units, 24% of neighbourhoods are in overbidding territory. Meanwhile, 76% of neighbourhoods are in overbidding for non-condo (freehold) homes.
Like in March, Markham once again was home to three of the top five overbidding hot spots for all housing types. “Markham has fewer listings than recent years and the listings coming to market are being priced below market value to attract multiple bids,” Katchen explains, noting that the area’s high-ranking schools also continue to entice bidders to battle over a limited number of listings.
| Rank | Neighbourhood | Overbid % | Median overbid amount | Median sold price |
| 1 | Raymerville, Markham | 24% | $363,000 | $1,861,000 |
| 2 | The Danforth, Toronto | 24% | $224,001 | $1,118,056 |
| 3 | Berczy Village, Markham | 21% | $252,000 | $1,450,000 |
| 4 | Devonsleigh, Richmond Hill | 21% | $230,100 | $1,375,000 |
| 5 | Cachet, Markham | 13% | $250,000 | $2,100,000 |
Conversely, neighbourhoods with negative percentage differences between listing and selling prices are in underbidding territory. Last month, the leading local markets for underbidding were concentrated in Toronto proper and Halton Region, including two in the municipality of Oakville. “Oakville has seen underbidding for most of the past year. It’s not because it’s a bad area. It’s because the home prices were so high to begin with, and interest rate hikes cut off a majority of the buyers from being able to afford a property in that area,” explains Katchen.
| Rank | Neighbourhood | Underbid % | Median overbid amount | Median sold price |
| 1 | Parkdale, Toronto | -8% | -$101,500 | $1,227,500 |
| 2 | Brookville, Milton | -7% | -$115,000 | $1,542,500 |
| 3 | Southwest Oakville | -6% | -$159,500 | $2,637,500 |
| 4 | Chaplin Estates, Toronto | -4% | -$95,000 | $2,470,162 |
| 5 | Eastlake, Oakville | -3% | -$98,000 | $2,950,000 |
In general, the top neighbourhoods for homes selling under asking were more expensive than the highest-ranked overbidding neighbourhoods. Note that three of the top underbidding markets had median sale prices north of $2 million. Only one of the top overbidding neighbourhoods had a median sale price exceeding that mark.
Although the GTA’s housing market appears to be showing early signs of recovery, it still has a ways to go before it approaches previous heights and the overbidding frenzies of past years. For example, a year ago, 86% (or 281 out of 326) of neighbourhoods were in overbidding territory. The share of overbidding neighbourhoods was steadily in decline as the Bank of Canada (BoC) continued to hike the overnight rate — which influences the mortgage market — through much of 2022 and into the New Year. From March 2022 to January this year, the central bank hiked the overnight rate eight consecutive times, bringing it from a historically low 0.25% to where it currently stands at 4.5%. With the BoC holding the rate steady for the past three months, some confidence might be finally returning to the housing market.