 Friday, July 26, 2024
  Friday, July 26, 2024
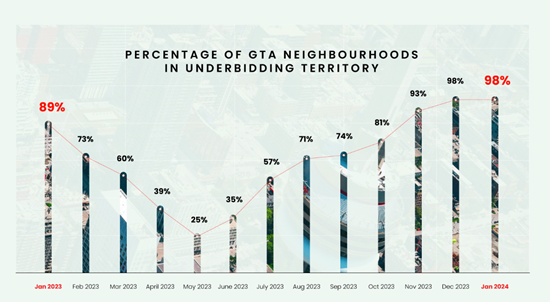
The share of Greater Toronto Area neighbourhoods in underbidding territory remains at the highest level in more than a year.
In January, 98% of GTA neighbourhoods were in underbidding territory, unchanged from the previous month. This is the eighth consecutive month that the share of underbidding neighbourhoods has increased or remained flat. January is also tied for the highest share of underbidding neighbourhoods recorded since Wahi began tracking bidding activity in July of 2022, matching the high seen in December 2023.
At the end of each month, Wahi compares the differences between median list and sold prices to determine whether a neighbourhood is in overbidding or underbidding territory, excluding those neighbourhoods with fewer than five transactions in a given month. The top overbidding and underbidding neighbourhoods are ranked by the median overbid or underbid amount. This is calculated by subtracting the sold price from the list price of each individual listing in a given neighbourhood. These are then ranked by the median of all subtractions and presented as the median overbid or underbid amount.
Based on these criteria, only 55 of the GTA’s approximately 400 neighbourhoods were evaluated in January as many areas didn’t see sufficient sales activity (in December, 122 neighbourhood saw at least five transactions). Note that seasonal factors can influence bidding activity. For example, with more limited competition during the winter months, bidding wars may be less likely. Seller behaviour can also have an impact, such as if a home is listed below its true value in hopes of sparking a bidding war.
“The Bank of Canada’s rate hikes last year are clearly having an impact on real estate markets across southern Ontario,” says Wahi CEO Benjy Katchen. “Although we are starting to see some signs of multiple offers across the GTA, the larger trend continues to be one of underbidding.
With interest rates recently stabilizing or in some cases even falling, now could be a great time to potentially purchase a home,” Katchen continues. He notes that homebuyers may have a greater selection of properties for sale and can potentially cut a sharper deal than just six months ago.
As in previous months, the top underbidding neighbourhoods were generally located within more expensive areas, although there was one exception this month in Toronto’s Queensway neighbourhood, where the median selling price is below $1 million:
| Rank | Neighbourhood | Median underbid amount | Median sale price |
| 1 | Lakeview, Mississauga | -$188,000 | $1,560,000 |
| 2 | Eastlake, Oakville | -$159,950 | $2,985,000 |
| 3 | Patterson, Vaughan | -$104,000 | $1,545,000 |
| 4 | West Oakville | -$94,443 | $1,405,000 |
| 5 | The Queensway, Toronto | -$84,900 | $815,000 |
No neighbourhoods were in overbidding territory, and Windfields, in Oshawa, was the lone neighbourhood selling at-asking with a median sale price of $899,000. Meanwhile, the GTA-wide median underbid amount was $18,000, putting it within the top five among major Ontario housing markets:
| Rank | Housing Market | Median underbid amount | Median sale price |
| 1 | St. Catharines | -$24,450 | $581,000 |
| 2 | Hamilton | -$19,000 | $640,000 |
| 3 | GTA | -$18,000 | $895,000 |
| 4 | Barrie | -$14,999 | $679,500 |
| 5 | London | -$14,900 | $575,500 |
To see the latest overbidding and underbidding analysis, check out Wahi’s Market Pulse tool, an interactive interface that maps out where bidding activity is strongest and weakest based on the latest available data from the past 30 days.
Check out more news and blogs here